


How much are you losing to poor performance and high fees?
The goal of this blog is to explain how a slight increase in returns or a modest reduction in fees can have a significant impact on the long-term value of an investment portfolio.
There are a few housekeeping items with regards to the assumptions used for the graphs. The graphs assume no contributions or withdrawals and a starting value of $1mm. The purpose is to show how slightly different returns/fees can affect your portfolio over time. For example, the graph below shows seven portfolios earning slightly different yearly returns ranging from 4% to 7% over a 30-year period.
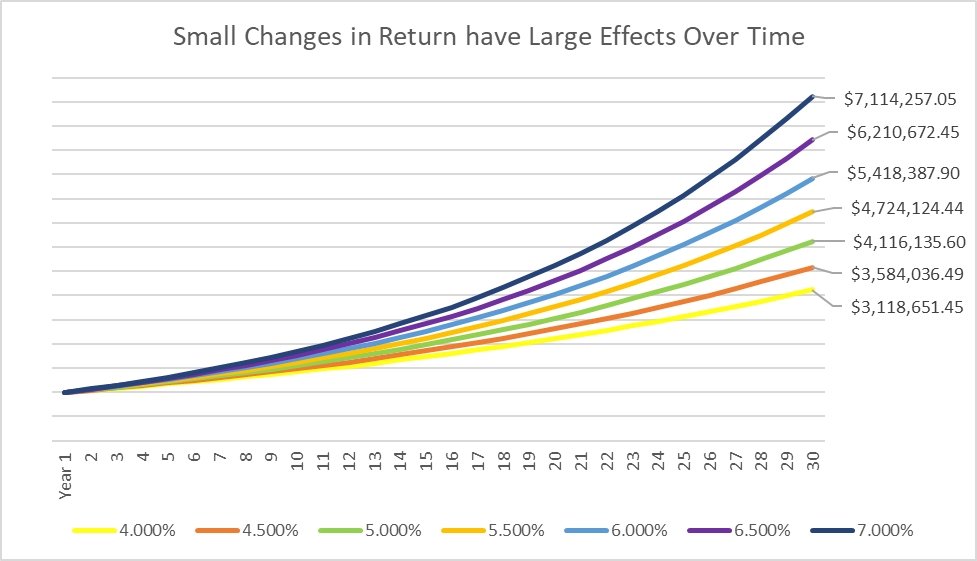
As we can see from the chart, early on there is no noticeable disparity between the portfolios, but by year 10 we can start to visually see them. Those gaps widen the longer the time horizon. At year 30, we can see a difference of $465,385 between the portfolios earning 4% and 4.5%, while the difference between the 6.5% and 7% portfolios is $903,584. The larger variance in these values is due to compounding and exponential growth when it comes to investing. Even though each portfolio starts at $1mm, the future growth happens on all prior growth. For example, if you earn 7% your first year, you now have $1,070,000. Now any future gains are not based on the $1mm initial investment, but $1,070,000. The formula is as follows, T = P(1+R)^x. T stands for your account value at the end (unknown), P is for the beginning value, (1+R) is the return rate, and ^x is the number of periods to be compounded.
On the flip side, we have fees. Just like returns, fees have an impact on your portfolio value over time. There is one big difference though, savings on fees are nearly guaranteed and are in perpetuity. That means if you can lower your fees by 0.25%, you will save that money each year. Below I have created a graph to show the difference in portfolio values over a 30-year period when we compare retail shares vs. institutional shares vs. our fees. The retail and institutional examples assume the advisor charges 1% (which is average) and NO COMMISSIONS, while VHFA shows our average client fee (Management fee plus mutual fund expenses).
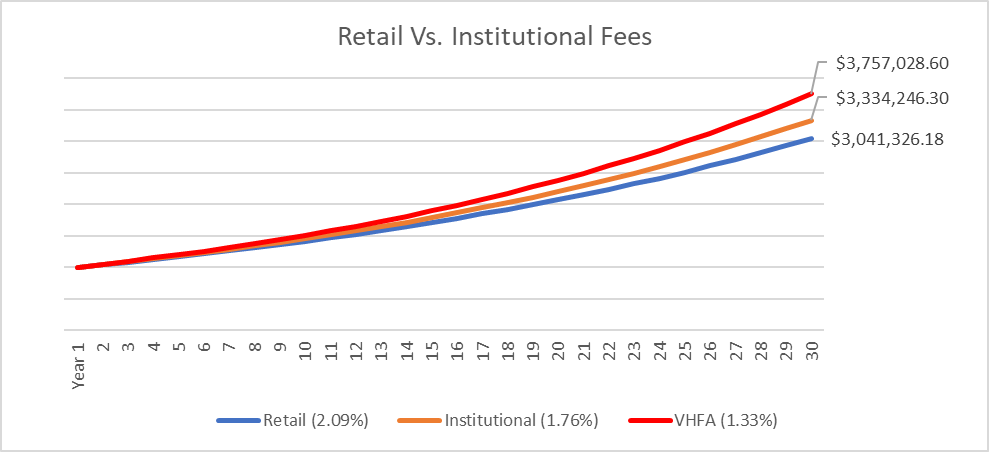
As we can clearly see above, fees are a major factor in long-term performance. The difference between the institutional and VHFA fees (1.76-1.33 = 0.43) adds up to $422,782 over the course of 30 years. This is why it is so important to understand fee structures including whether your advisors are getting commissions or have revenue sharing agreements, if they are over-charging or have high mutual fund fees, and how the fees accumulate over time.
Additionally, you should verify whether an advisor offers full service financial advice by bundling financial planning and wealth management services together when considering if the fee is fair and reasonable. Advisors that bundle services could include retirement planning, and collaboration with your tax and estate planning professionals along with portfolio management. Our firm bundles all services into a single fee schedule.
Modest improvements in portfolio returns and minor reductions in fees can have dramatic long-term impacts with regards to portfolio values which will increase the chances of having a financially successful retirement. Make sure you understand the services that will be provided, and how and what you are being charged before hiring an advisor.